


October 27, 2019
Visualising common patterns using MISP and ATT&CK data
Having access to a large amount of Threat information through MISP Threat Sharing communities gives you outstanding opportunities to aggregate this information and take the process of trying to understand how all this data fits together telling a broader story to the next level. We are transforming technical data or indicators of compromise (IOCs) into cyber threat intelligence. This is where the analytical challenge begins.
In his Psychology of Intelligence Analysis book, Richards Heuer, a reference in intelligence analysis, describes some of the power and limitations our mental machinery has. While discussing the short term memory, long term memory and working memory he concludes the following:
A well-known article written over 40 years ago, titled “The Magic Number Seven—Plus or Minus Two,” contends that seven—plus or minus two—is the number of things people can keep in their head all at once. That limitation on working memory is the source of many problems. People have difficulty grasping a problem in all its complexity. This is why we sometimes have trouble making up our minds. For example, we think first about the arguments in favor, and then about the arguments against, and we can’t keep all those pros and cons in our head at the same time to get an overview of how they balance off against each other.
The recommended technique for coping with this limitation is to externalise the problem. We need to get it out of the human head into a form that simplifies the story, shows the main elements and how they relate to each other. In this article we will be using visualisation techniques to help us better explore cyber threat information shared through MISP and tagged with MITRE ATT&CK techniques, all within a visualisation tool called Maltego.
Getting started
To get started you will need access to a MISP Threat Sharing community, or run your own instance. As a quickstart, you can use the MISP Training VM and download data from the CIRCL OSINT feed.
You will want to download the Maltego CE (free, limited) or the classic (paid) edition and install the open source MISP-Maltego transform.
The report
As an example, when looking at the report of attacks called “PcShare Backdoor Attacks Targeting Windows Users with FakeNarrator Malware”, published by Cylance on the 25th of September 2019, and shared using MISP to ‘All Communities’ with the UUID 5d9b5ad3-6b64-4962-a63c-42ae73e10023. They also attributed the attack to the Tropic Trooper - G0081 actor.
Analysis and Visualisation
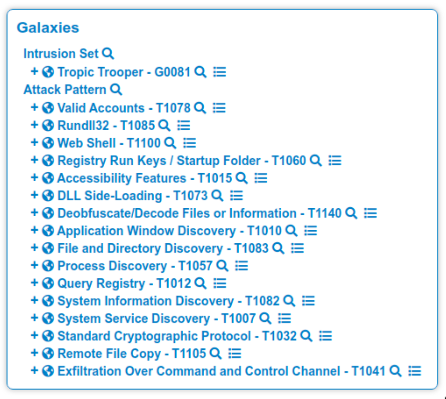
In addition to the technical report of these attacks and the leveraged malware, the author documented 16 related ATT&CK techniques. Interestingly MITRE associated 18 ATT&CK techniques to this actor. An avid reader will immediately notice the report has 2 techniques fewer than the actor described by MITRE.
Is this correct or is the reality completely different?
Keeping in mind the limitations of our working memory (7±2 items) we will need additional external support to compare the techniques. Whilst we could indeed take two papers and compare both lists for the duration of 5 minutes, let us do the exercise in a more visual and dynamic way.
Open Maltego and create a MISPEvent entity with the MISP event number on your MISP server (for me this is 63423). Right click on the event and choose “Event To Galaxies”.
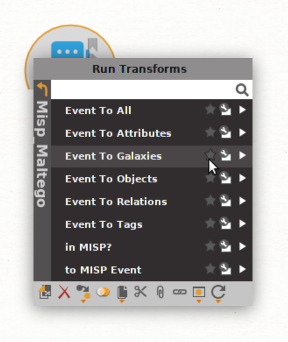
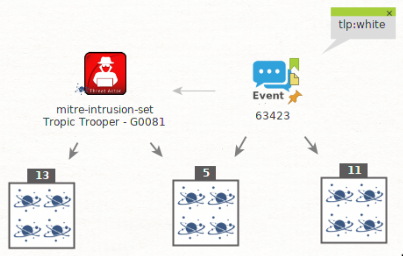
We now have a first visual view of the tags that were attached to the report. Now, select the threat actor and choose Galaxy to Relations again, in order to expand this using MITRE ATT&CK relationships.
We now see a completely new graph which is much less readable. Make sure you configure Maltego to make collections of 4 or more similar entities. You can do this in the toolbar in the top: 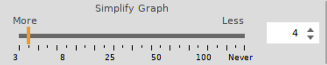
Suddenly our graph becomes much more readable and we see at a glance that our initial intuition of two missing techniques was actually completely wrong ! The Cylance report of these attacks does NOT have two (2) techniques fewer than expected. Actually, only five (5) are common with what MITRE documented! Thirteen (13) are only present in the MITRE documentation and eleven (11) are not associated with this actor by MITRE. Zooming in allows us to see the details:

What does this mean?
Does this mean Cylance or MITRE are wrong? Not necessarily, many factors can explain this, for example:
- When creating and updating ATT&CK, MITRE only had incomplete knowledge of each actor. They only saw a piece of the puzzle.
- Actors change their behaviour and their TTPs evolve over time.
- We have also seen that tagging techniques can be a very subjective exercise. Additionally, the current techniques are sometimes very generic and their understanding is not universal. To address this challenge MITRE has been developing sub-techniques.
- potentially others that are not covered in this article.
The beginning of a long journey
This example is only the beginning of a long journey of analysing and understanding the data which is available to us.
We always need to keep in mind that we only see a fragment of the entire story. Only by combining what you see in your network or constituency and what others see in theirs will we be able to better analyse and understand what is going on. This is yet another good reason to share cyber threat information with trusted communities.
We also know we have limited mental capabilities and can be assisted by technology to help ourselves with this challenge, for example with graphing and visualisation tools that are interconnecting with MISP!