


By Sascha Rommelfangen August 18, 2020
MISP service monitoring (and a bit of healing) with OpenNMS
Introduction:
Many organisations adore how quick and easy MISP can be set up. Once it’s running, people start integrating it into their processes and begin to rely on it, for instance by exporting indicators and using them in security or network focused software. Usually this is the time when MISP becomes a fundamental part in the portfolio of fighting attacks, and the need for reliability grows rapidly.
This blog post shows how MISP as a service can be monitored easily with OpenNMS, in order to show outages or slowness in answering requests. But we don’t stop there. OpenNMS can also be used to repair components that might need a poke here and there
Requirements:
MISP
Any (recent) MISP installation is perfectly fitting the requirements to reproduce what’s demonstrated in this article.
OpenNMS
The free and open source OpenNMS Horizon in version 26.1.1 is used for the purpose of this article.
Implementation
Assuming you have both a working MISP and an OpenNMS instance running, we can jump straight to the specific monitoring parts of the configuration process.
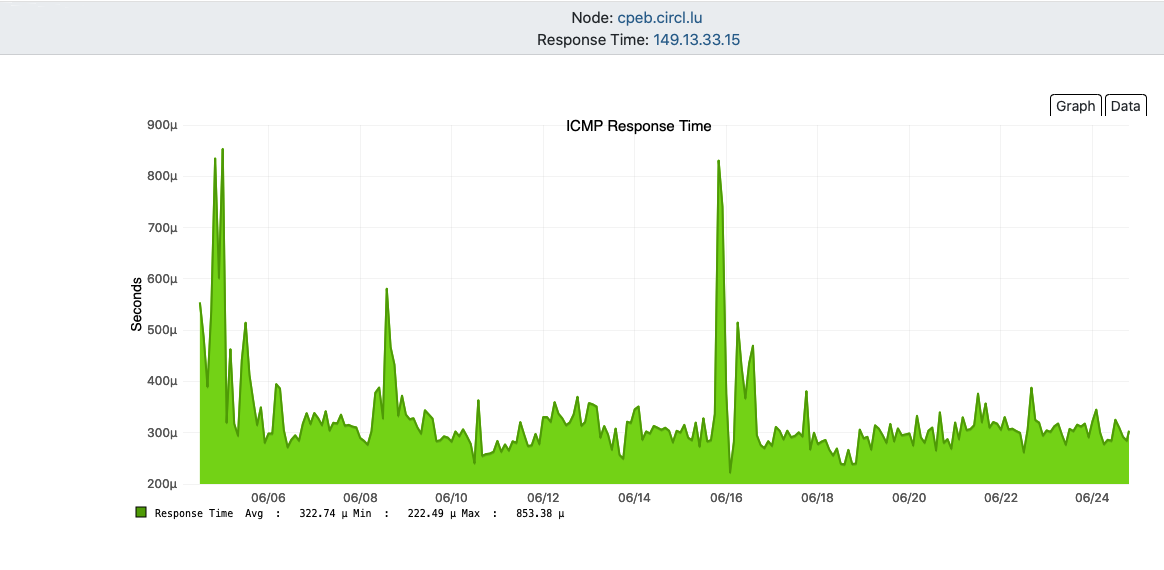
ICMP monitoring
This is the most simple form of monitoring in OpenNMS. It will be enabled by default and checks if the machine hosting MISP will be answering ICMP (‘ping’) packets. ICMP monitoring acts more like an on/off-switch monitoring, but it can also tell you statistically and historically something about the load of the machine and the network conditions due to the recorded response times.
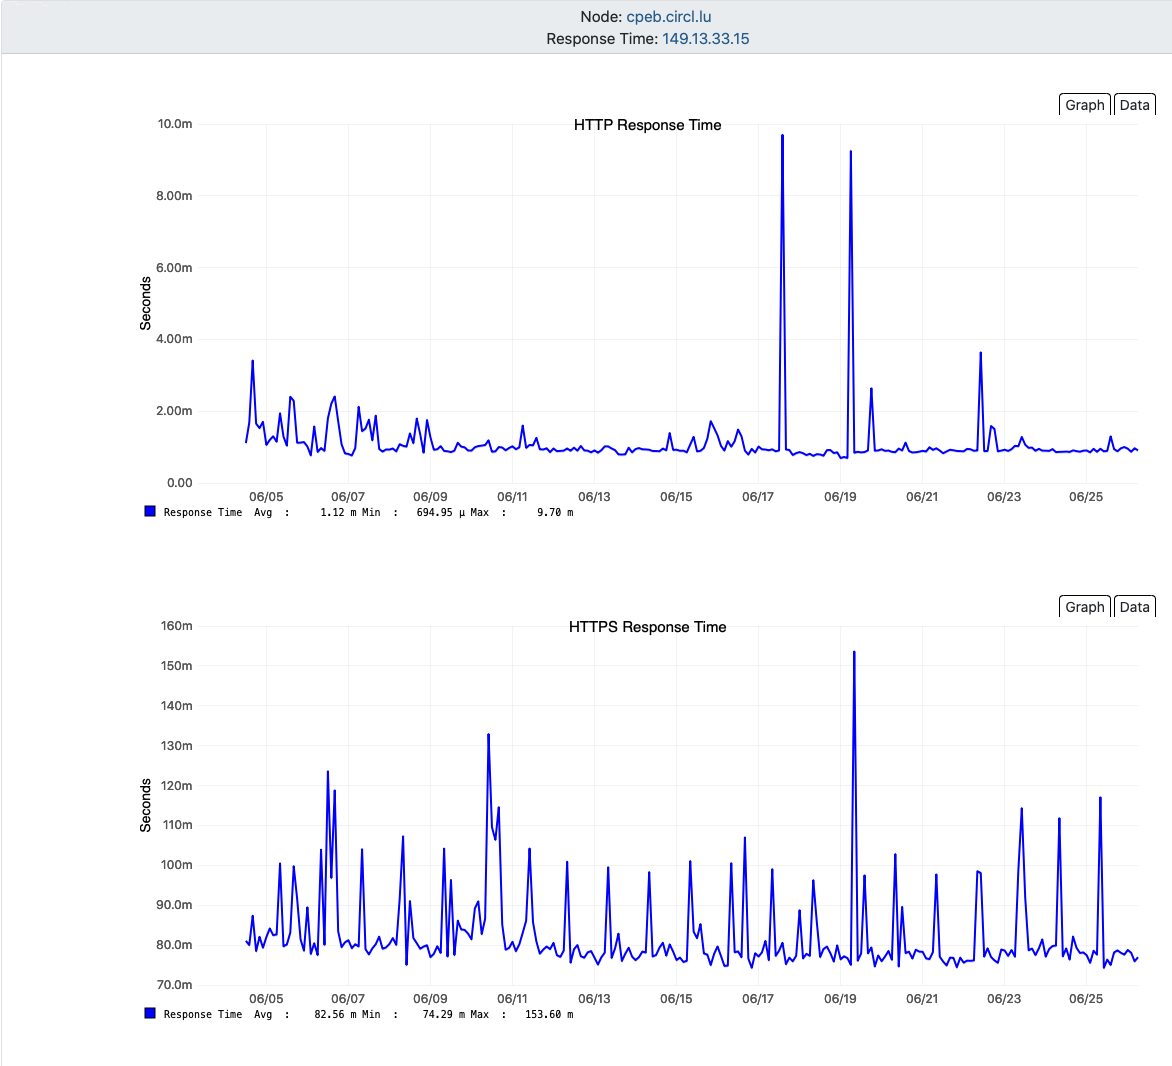
HTTP(S) monitoring
HTTP and HTTPS monitoring are also built-in into OpenNMS and activated by default if the server exposed TCP ports 80 and 443 during the initial scan. This check is quite handy to see if the web server is running, but doesn’t tell you if the application behind this web server is acting properly.
As in ICMP monitoring, OpenNMS is collecting the data over time and is able to give us an historic view on the response times without any additional configuration.
Application monitoring
Simple HTTPS status/output monitoring
Here we are going into more detail. We would like to see if the Login screen of MISP (url key) returns an HTTP status code in the 200 range (response key) and if the content contains the word ‘Login’ (response-text key).
This configuration is to be adjusted (especially the host-name key) and to be put into poller-configuration.xml
        <service name="misppriv" interval="300000" user-defined="false" status="on">
            <parameter key="retry" value="1"/>
            <parameter key="timeout" value="3000"/>
            <parameter key="port" value="443"/>
            <parameter key="host-name" value="misppriv.circl.lu"/>
            <parameter key="url" value="/users/login"/>
            <parameter key="response" value="200-202,299"/>
            <parameter key="response-text" value="~.*Login.*"/>
        </service>
        <monitor service="misppriv" class-name="org.opennms.netmgt.poller.monitors.HttpsMonitor"/>
After adding a service to poller-configuration.xml it is necessary to perform two additional steps:
-
restart OpenNMS or execute the following command
/opt/opennms/bin/send-event.pl -p 'daemonName Pollerd' uei.opennms.org/internal/reloadDaemonConfig -
Add in OpenNMS web interface’s
Provisioning Requisitionsthe newly created service (mispprivin this example) as a service to the interface of the specific node, and synchronize the database.
The first step is also needed every time a configuration change has been done to poller-configuration.xml.
REST interface monitoring
We can also monitor if the underlying REST interface is working properly.
        <service name="misppriv-rest" interval="300000" user-defined="false" status="on">
            <parameter key="script" value="/etc/opennms/monitoring-scripts/misp-rest.sh"/>
            <parameter key="args" value="misppriv.circl.lu YOURAPIKEYHERE"/>
            <parameter key="banner" value="OK"/>
            <parameter key="retry" value="2"/>
            <parameter key="timeout" value="10000"/>
            <parameter key="rrd-base-name" value="monitoring-script"/>
            <parameter key="rrd-repository" value="/var/lib/opennms/rrd/response"/>
        </service>
        <monitor service="misppriv-rest" class-name="org.opennms.netmgt.poller.monitors.SystemExecuteMonitor"/>
Since the following tests are a bit too specific for the default monitoring capabilities of OpenNMS, we are helping ourselves with an external monitoring script which is placed in the subdirectory monitoring-scripts. The content of the file is the following:
#!/bin/bash
HOST="$1"
KEY="$2"
RESP=$(/usr/bin/curl  -H "Authorization: ${KEY}"  -H "Accept: application/json"  -H "Content-type: application/json"  https://${HOST}/events/index/limit:60/page:1/searchminimal:1)

if [[ "${RESP}" =~ 'uid' ]]; then
  echo "OK"
  exit 0
else
  echo "KO"
  exit 1
fi
It requests the REST equivalent of the Event Index view of MISP. If something goes wrong and the page doesn’t contain the term uid it will report a failure. Please note the timeout key whose value is set to 10000 (10 seconds). That means we give MISP a good amount of time to reply, even under heavy load.
REST interface slow
We can use the same concept as in the example before to monitor if the REST interface is slow.
The sole difference is the timeout key’s value of 5000 or 5 seconds. If it takes longer, OpenNMS will show for you to know and to analyse the cause that the REST interface is slow.
        <service name="misppriv-rest-slow" interval="300000" user-defined="false" status="on">
            <parameter key="script" value="/etc/opennms/monitoring-scripts/misp-rest.sh"/>
            <parameter key="args" value="misppriv.circl.lu YOURAPIKEYHERE"/>
            <parameter key="banner" value="OK"/>
            <parameter key="retry" value="2"/>
            <parameter key="timeout" value="5000"/>
            <parameter key="rrd-base-name" value="monitoring-script"/>
            <parameter key="rrd-repository" value="/var/lib/opennms/rrd/response"/>
        </service>
        <monitor service="misppriv-rest-slow" class-name="org.opennms.netmgt.poller.monitors.SystemExecuteMonitor"/>
MISP worker monitoring (and a bit of self-healing)
MISP workers take care of the processing of various tasks around MISP. The most intuitive is the dispatching of Emails to all subscribed users once an event is published. If can be annoying if MISP workers die and it’s not immediately observed and reacted to. This happens from time to time and can be fixed with a simple restart of the workers, for instance from the web interface.
To be able to react quickly to such an outage, we can configure a test in OpenNMS:
        <service name="misppriv-worker" interval="300000" user-defined="false" status="on">
            <parameter key="script" value="/etc/opennms/monitoring-scripts/misp-worker.sh"/>
            <parameter key="args" value="misppriv.circl.lu YOURAPIKEYHERE"/>
            <parameter key="banner" value="OK"/>
            <parameter key="retry" value="2"/>
            <parameter key="timeout" value="5000"/>
            <parameter key="rrd-base-name" value="monitoring-script"/>
            <parameter key="rrd-repository" value="/var/lib/opennms/rrd/response"/>
        </service>
        <monitor service="misppriv-worker" class-name="org.opennms.netmgt.poller.monitors.SystemExecuteMonitor"/>
Again, this test is using an external script placed in monitoring-scripts. The file has the following content:
#!/bin/bash
HOST="$1"
KEY="$2"
RESP=$(/usr/bin/curl  -H "Authorization: ${KEY}"  -H "Accept: application/json"  -H "Content-type: application/json"  https://${HOST}/servers/getWorkers | jq '.[].workers[].ok')
if [[ "${RESP}" =~ 'false' ]]; then
  echo "KO"
  exit 1 # to record the outage
else
  echo "OK"
  exit 0
fi
This test is checking the worker’s status through the REST API. If the answer from the server contains the term false, OpenNMS will record an outage for you to react and restart the MISP workers.
It is also possible to let this OpenNMS monitoring script restart the workers once a failure has been recorded. Just modify the aforementioned script and add two lines:
#!/bin/bash
HOST="$1"
KEY="$2"
RESP=$(/usr/bin/curl  -H "Authorization: ${KEY}"  -H "Accept: application/json"  -H "Content-type: application/json"  https://${HOST}/servers/getWorkers | jq '.[].workers[].ok')
RESTART=$(/usr/bin/curl -d '{}' -H "Authorization: ${KEY}"  -H "Accept: application/json"  -H "Content-type: application/json" -X POST https://${HOST}/servers/restartDeadWorkers)
if [[ "${RESP}" =~ 'false' ]]; then
  echo "KO"
  ${RESTART}
  exit 1 # to record the outage
else
  echo "OK"
  exit 0
fi
The API call /servers/restartDeadWorkers will take care in most of the cases of your broken workers.
Summary
MISP and OpenNMS is a grateful combination of Open Source projects. They play very well together and with moderate configuration effort it is possible to monitor services in great detail, tailored to the needs of the application owner. OpenNMS’ extensibility through external monitoring scripts and the open approach of MISP exposing health-checking functions (and a lot more) through it’s REST API are complementing the experience.