


By Luciano Righetti April 5, 2024
MISP - Elastic Stack - Docker
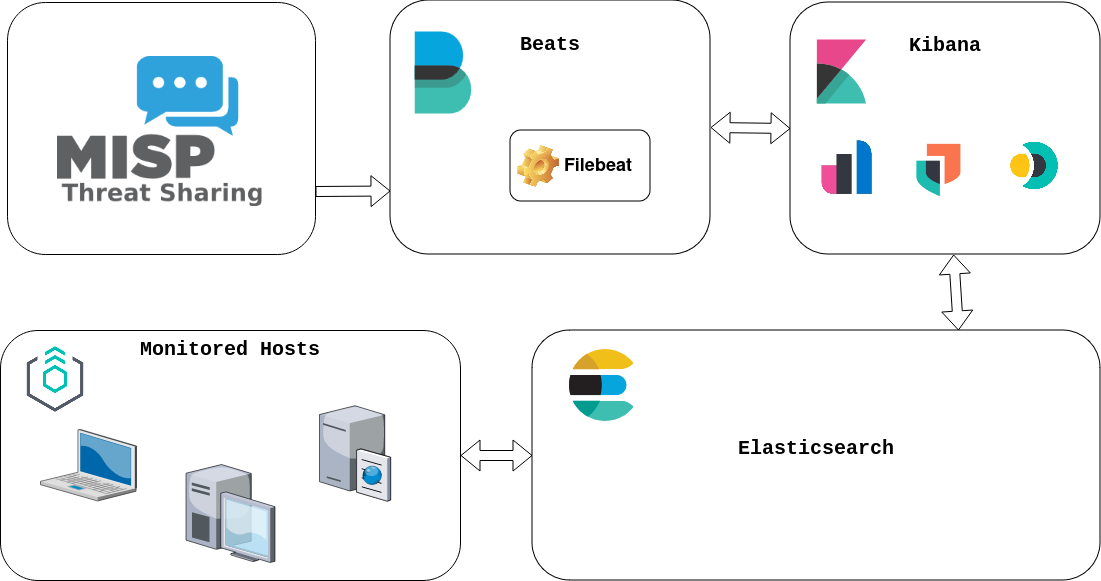
This lab explains how to connect MISP to the Elastic Stack in order to leverage IOCs from MISP and trigger alerts based on user defined rules.

MISP is used to gather IOCs from different sources such as open source Threat Intelligence feeds.
Filebeat pulls IOCs from MISP and pushed them to the Elasticsearch instance via the Threat Intel module 1.
To simplify this guide Elastic Agent 2 in installed standalone mode is installed on the hosts we want to monitor, but Fleet 3 could be used instead.
Kibana 4 is used for exploring the IOCs, creating rules and visualizing the alerts.
Everything in this lab is run on Docker 5.
Installation
- Clone the lab repository.
$ git clone https://github.com/righel/elastic-misp-docker-lab.git & cd elastic-misp-docker-lab
MISP
-
Create the .env file:
$ cp template.env .env -
Start the MISP containers.
$ docker compose up -d -
When MISP containers finish starting, create a sync user for Elastic on MISP.
Using MISP CLI:
$ docker-compose exec misp-core app/Console/cake User create elastic@admin.test 5 1
$ docker-compose exec misp-core app/Console/cake User change_authkey elastic2@admin.test
Old authentication keys disabled and new key created: 06sDmKQK3E6MSJwsOhYT3N4NzfTpe53ruV0Bydf0
Using MISP UI:
Default MISP credentials
User: admin@admin.test
Password: admin
Elastic Stack
The yaml configuration files for Elasticsearch, Kibana and Filebeat are located in
elastic/config/directory. You can review and change these settings before deploying Elastic Stack.
For adjusting the Filebeat MISP Threat Intel module, check elastic/config/filebeat.yml:
filebeat.modules:
  - module: threatintel
    misp:
      enabled: true
      var.input: httpjson
      var.url: "https://${MISP_HOST}/events/restSearch"
      var.api_token: "${MISP_ELASTIC_API_KEY}"
      var.first_interval: 24h
      var.interval: 10m
      var.ssl.verification_mode: none
      var.filters:
        type: ["md5", "sha256", "sha512", "url", "uri", "ip-src", "ip-dst", "hostname", "domain"]
        tags: ['workflow:state="complete"']
For more details refer to the official docs:
-
Modify some environment variables before firing up Elastic Stack.
KIBANA_ENCRYPTION_KEY: Has to be 32 chars string to set upxpack.encryptedSavedObjects.encryptionKeyon Kibana.MISP_ELASTIC_API_KEY: The MISP API key generated in step 4 for the sync userelastic@admin.test.
-
Start the Elastic Stack containers.
$ docker-compose -f docker-compose.elastic.yml -d
Now you can use MISP and the Elastic Stack.
Creating Kibana detection rules
-
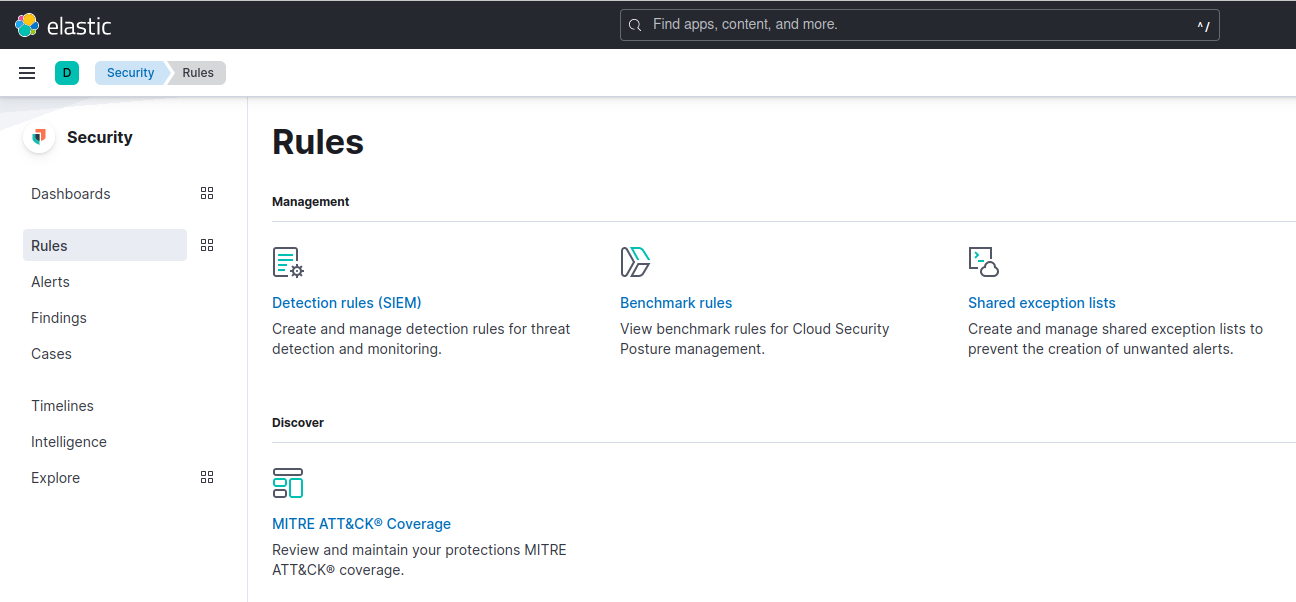
Go to Kibana > Security > Rules and click on Detection rules (SIEM)
-
Click on
 and search for Threat Intel, and select the rules you are interested on.
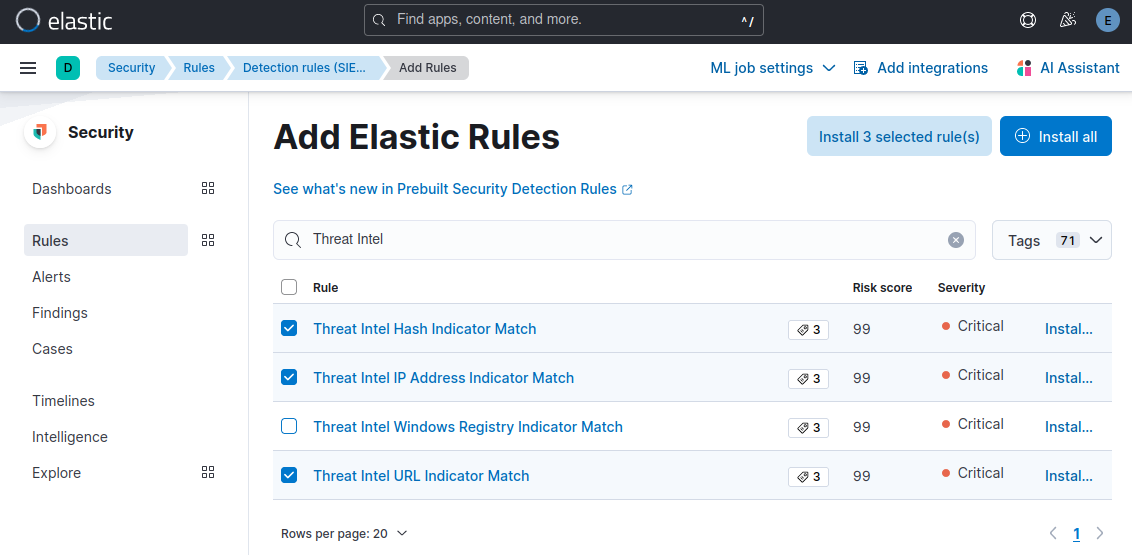
-
Click on

-
Go back to Kibana > Security > Rules and click on Detection rules (SIEM), click on the Disabled rules filter to show the recently installed rules (by default they are disabled), and enable them.
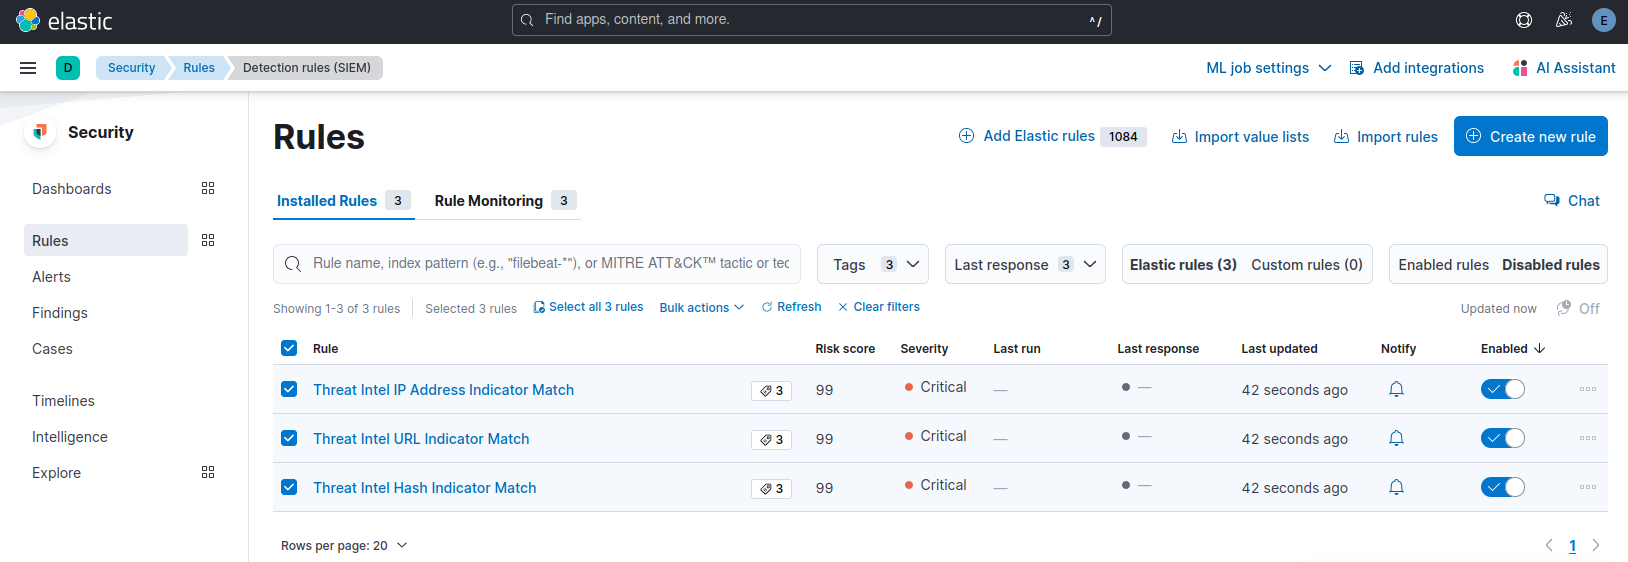
Now Elastic will generate alerts if it detects any hash, url or domain matching with MISP IOCs.
Demo
Install Elastic Agent (standalone)
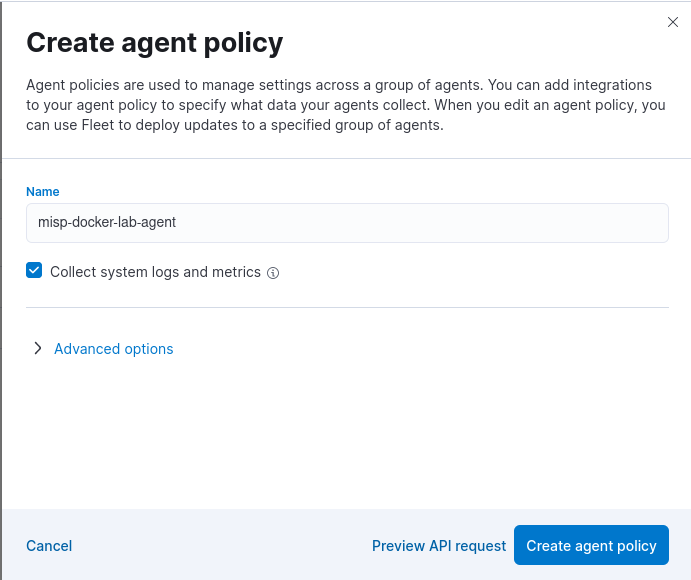
- Go to Kibana > Management > Fleet and switch to the Agent policies tab and click on the Create agent policy button.
-
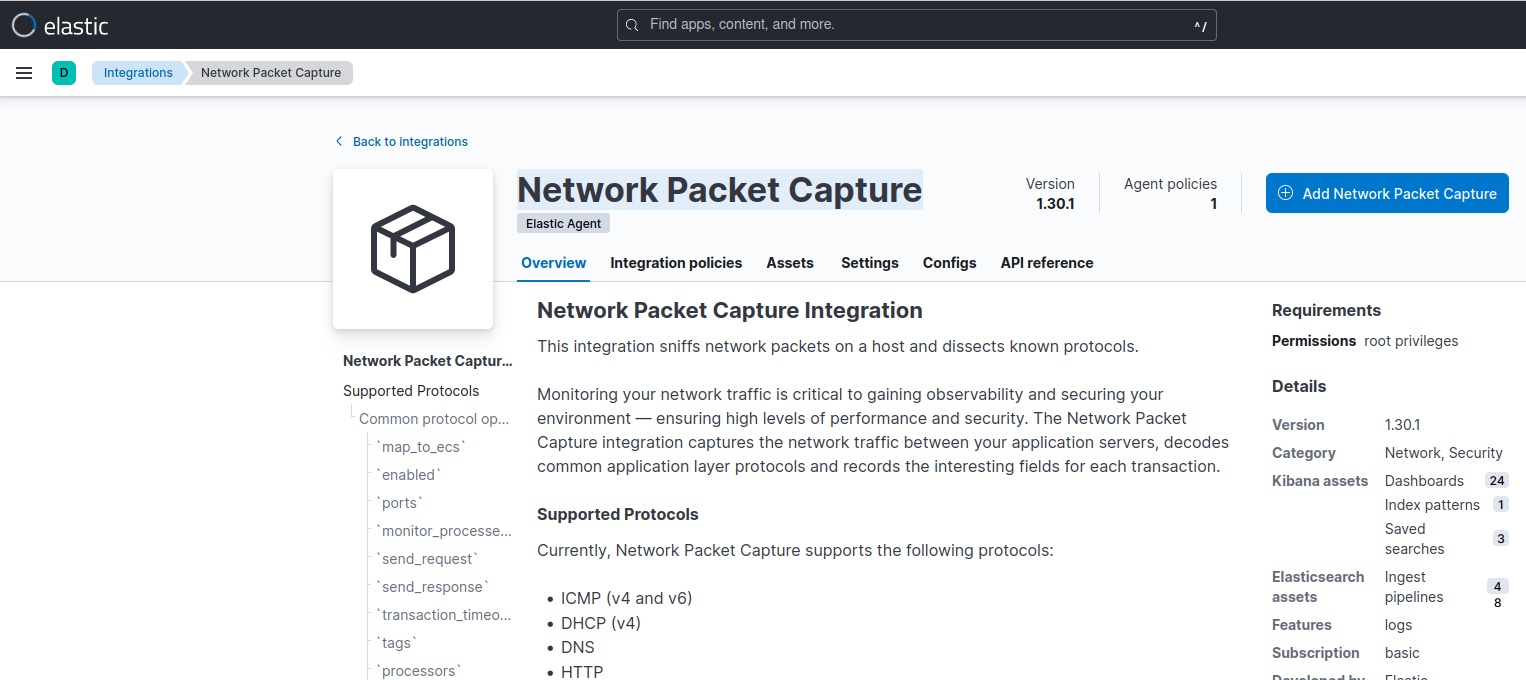
Click on the policy to access it and click on Add integration and search for Network Packet Capture, click on it and click on Add Network Packet Capture
-
Configure the Network Packet Capture integration if needed.
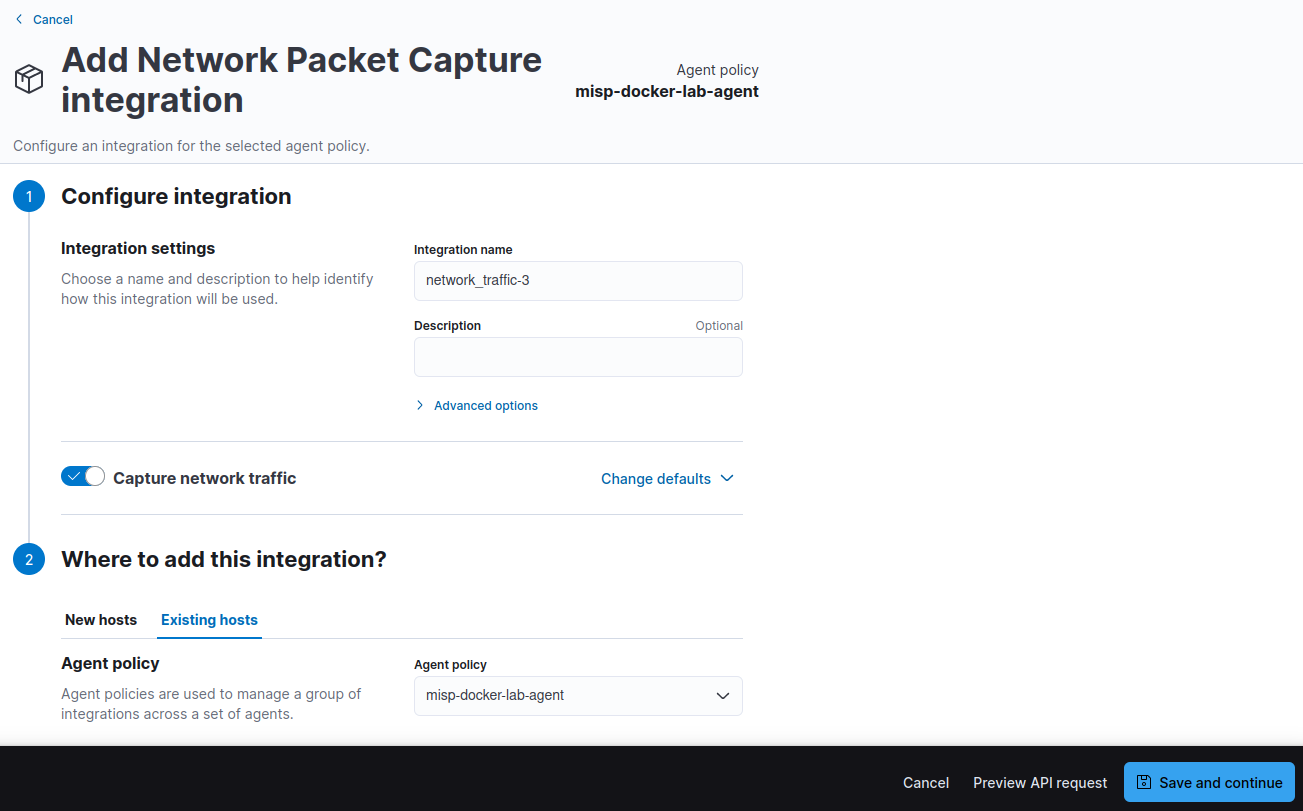
Click on Save and continue.
If prompted to add a Elastic Agent, click on Add Elastic Agent later.
-
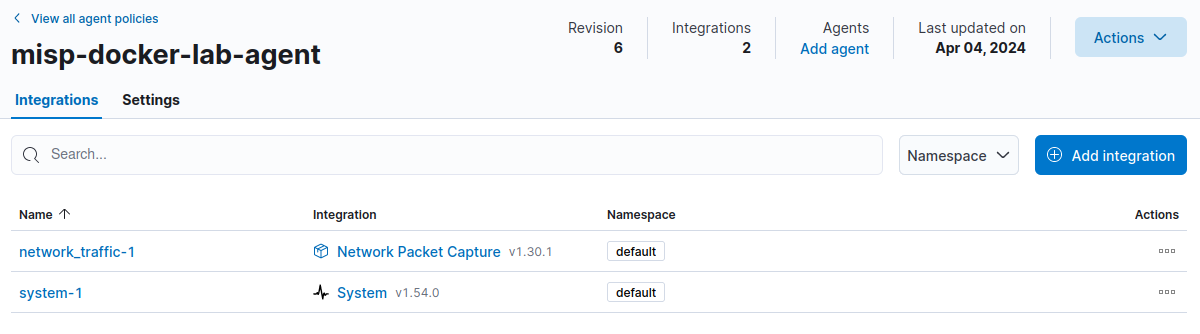
Click on Actions > Add agent, switch to the Run standalone tab.
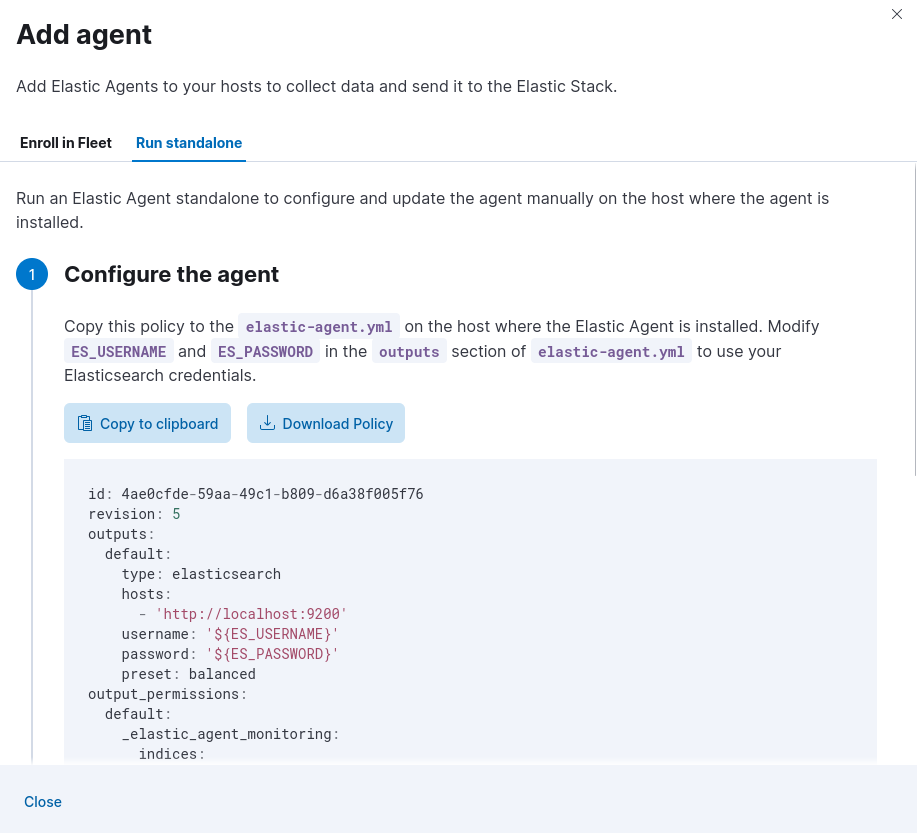
Click on Download Policy.
-
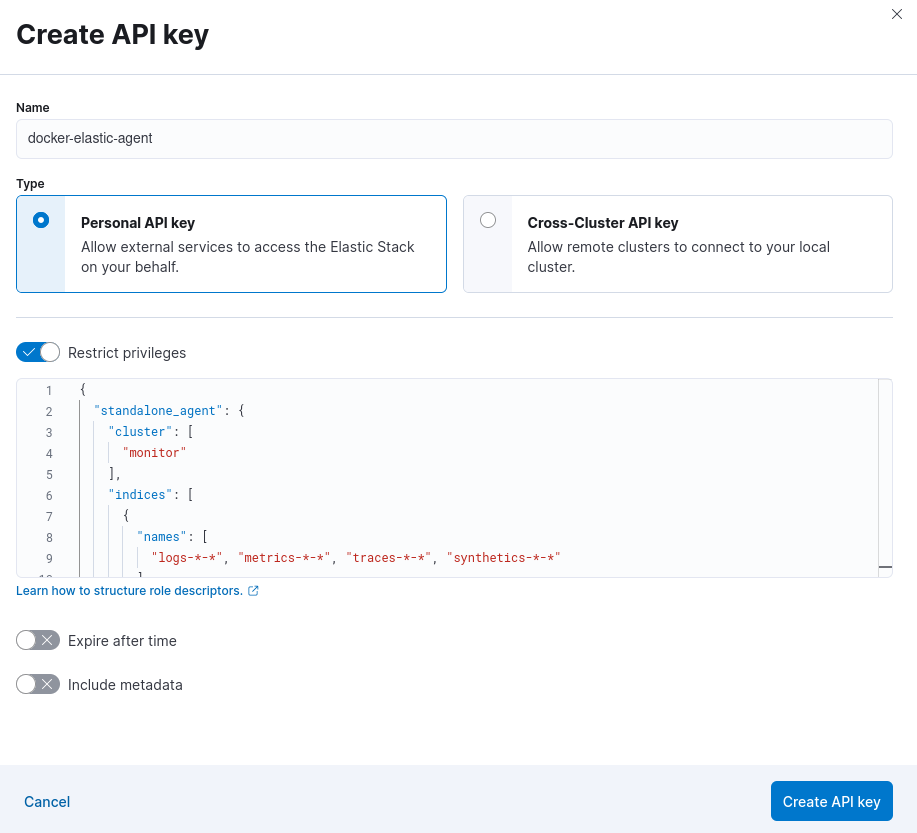
Create an API key for the Elastic Agent communication to Elasticsearch 6. Navigate to Kibana > Stack Management > API keys and click Create API key.
-
Enable the Restrict privileges toggle and copy the following configuration.
{ "standalone_agent": { "cluster": [ "monitor" ], "indices": [ { "names": [ "logs-*-*", "metrics-*-*", "traces-*-*", "synthetics-*-*" ], "privileges": [ "auto_configure", "create_doc" ] } ] } } -
Click on Create API key.
-
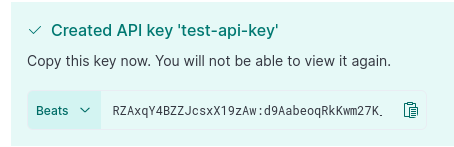
Select Beats and copy the API key.
-
-
Open the
elastic-agent.ymlconfiguration downloaded on step 5 and modify theoutputssection it to use API authentication and change the Elasticsearch host fromlocalhosttoelasticsearch.outputs: default: type: elasticsearch hosts: - 'http://elasticsearch:9200' api_key: 'RZAxqY4BZZJcsxX19zAw:d9AabeoqRkKwm27K_KEgKA' preset: balanced -
Install Elastic Agent in the host we want to monitor. Start an Ubuntu container and plug it to the MISP-Elastic Stack lab network.
$ docker run -it --network=elastic-misp-docker-lab_default --name=my_monitored_host ubuntu -
Follow the steps to install the standalone Elastic Agent 7.
$ curl -L -O https://artifacts.elastic.co/downloads/beats/elastic-agent/elastic-agent-8.13.1-linux-x86_64.tar.gz
root@be44a9a86e24:/# apt update
...
root@be44a9a86e24:/# apt install curl -y
...
root@be44a9a86e24:/# cd /tmp
root@be44a9a86e24:/# curl -L -O https://artifacts.elastic.co/downloads/beats/elastic-agent/elastic-agent-8.13.1-linux-x86_64.tar.gz
root@be44a9a86e24:/# tar xzvf elastic-agent-8.13.1-linux-x86_64.tar.gz
...

# from a different terminal, copy the elastic-agent.yml config file into the container
docker cp elastic-agent.yml my_monitored_host:/tmp/elastic-agent-8.13.1-linux-x86_64/elastic-agent.yml

# back on the docker terminal, install the agent
root@be44a9a86e24:/# cd elastic-agent-8.13.1-linux-x86_64/
root@be44a9a86e24:/# ./elastic-agent install
    Elastic Agent will be installed at /opt/Elastic/Agent and will run as a service. Do you want to continue? [Y/n]:Y
    Do you want to enroll this Agent into Fleet? [Y/n]:n
    [=   ] Service Started  [32s] Elastic Agent successfully installed, starting enrollment.
    [=   ] Done  [32s]
    Elastic Agent has been successfully installed.
Done. Now the docker container is being monitored by the Elastic Agent and the metrics are being pushed to Elasticsearch.
Testing
-
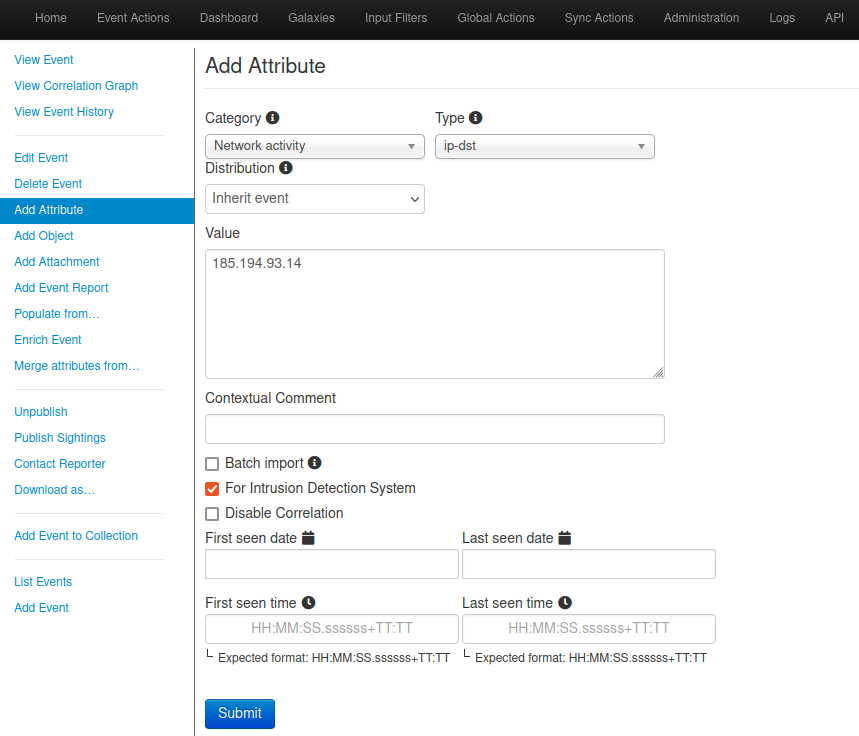
Go to MISP, create a new Event an add a ip-dst type attribute. 2.
-
Add the workflow:state=“complete” tag to the event to it is picked up by Elasticsearch.
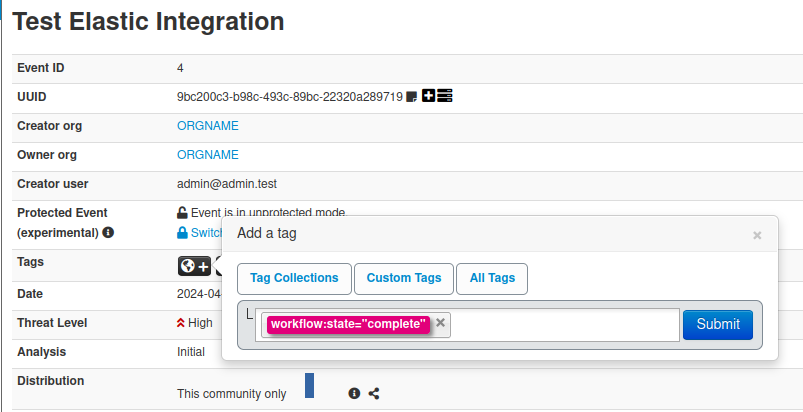
-
Publish the Event.
Depending on the
vars.intervalset on the Threat Intel module in thefilebeat.ymlconfiguration file, it may take some time for the IOC to get into Elasticsearch.
-
From your monitored docker host, generate traffic to one of the MISP IOCs.
root@be44a9a86e24:/# curl -I https://circl.lu ... -
Navigate to Kibana > Security > Alerts, you should now see some alerts triggered by the Threat Intel IP Address Indicator Match.
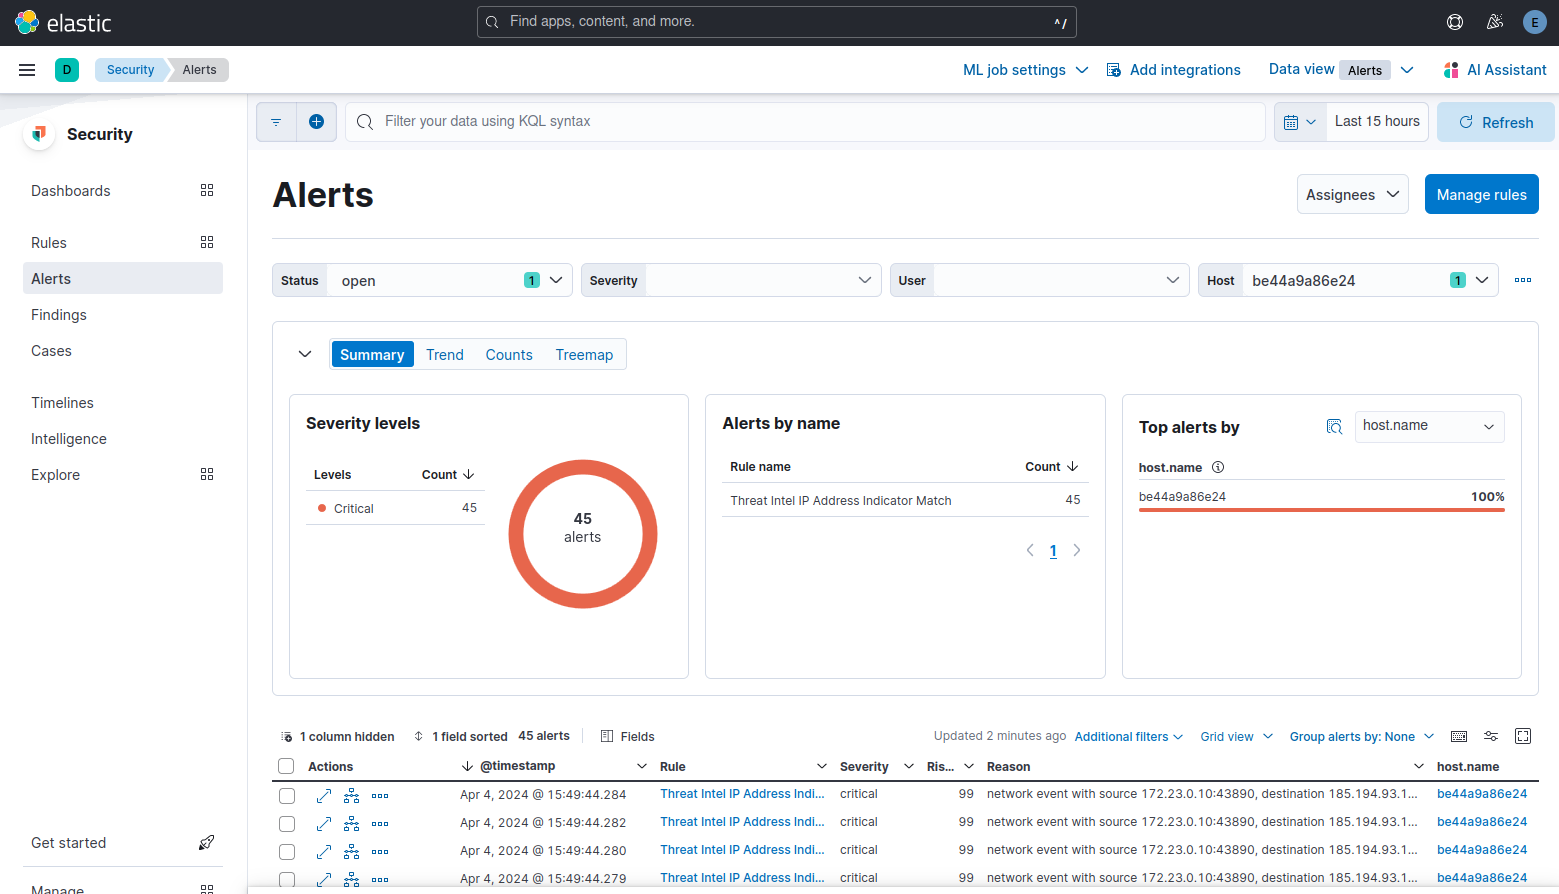
By default Elastic runs these detection rules every 4 hours, you can configure the internal reduce
Done! Now you will get alerts on Kibana when an event in one of your monitored hosts matches a MISP IOC.
-
https://www.elastic.co/guide/en/beats/filebeat/current/filebeat-module-threatintel.html ↩︎
-
https://www.elastic.co/guide/en/fleet/current/install-standalone-elastic-agent.html ↩︎
-
https://www.elastic.co/guide/en/fleet/current/fleet-overview.html ↩︎
-
https://www.elastic.co/guide/en/fleet/current/grant-access-to-elasticsearch.html ↩︎
-
https://www.elastic.co/guide/en/fleet/current/install-standalone-elastic-agent.html ↩︎